

October 30, 2026
AMERICA'S GERONTOCRACY
This past year, three news stories highlighted noteworthy developments in the older demographic of the United States. In 2025, a study revealed that almost 20% of the United States labor force was 65 or older, the age traditionally associated with retirement. In 2000, that percentage was 13. At the same time, it was reported that the older half of America's population had become wealthier than at any other time in history, possessing almost 90% of all the wealth in the country. It was also pointed out that our national legislators are among the oldest we've ever had. Currently, 184 members of Congress are 65 years or older, or 34% of the Congress. Not only are these three stories related, but the data seems to support the idea that this situation was calculated.
Over the past century, average life expectancy in the United States has increased steadily, growing from 47.3 in 1900 to 79.0 in 2024. That's a 67% increase over 124 years, or a 3-month increase in life expectancy every year. The average age of the United States population has also increased during the same time, rising at roughly the same percentage, 71%, but at a smaller average of 1.6 months every year. But beginning in 1980, there was a sharper uptick, and the average age in the country began increasing by 2.5 months every year.
Meanwhile, the average age of Congressional legislators has risen by only 16%, from 52.7 in 1900 to 61.0 in 2024. The reality is that Congress has always been old. Before 1920, the average age in Congress was older than the average life expectancy in the United States. Since 1900, the average age of Congressional members has been 25.3 years greater than the average age of United States population. Interestingly, during the past 124 years, the gap between those two groups has closed by nine years. So while Congress has always been old, it is not as old today as it was in the past when compared with the average age of the country. Yes, this is one of the oldest Congressional session in the country's history, but this is also the oldest population the country has ever had.
USA AGE STATISTICS
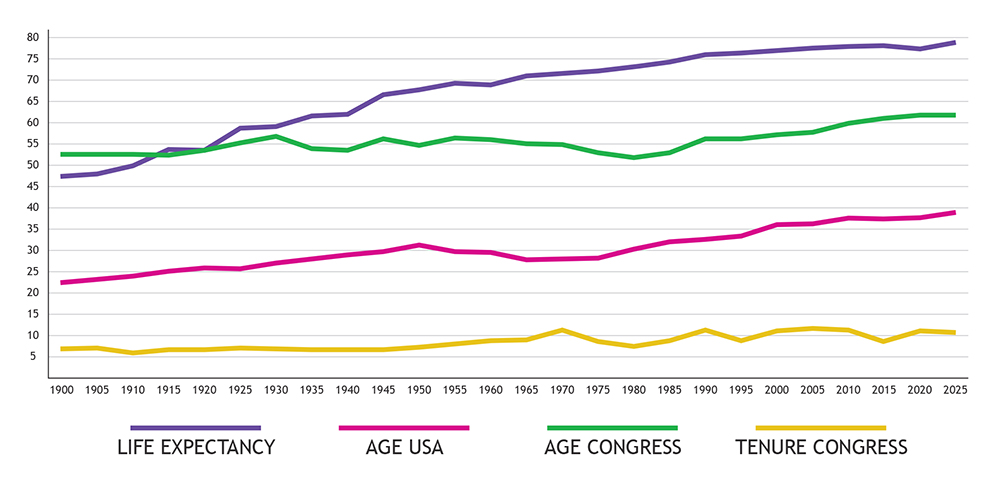
A more interesting development can be seen when viewing the trends on a graph. Something obviously changes around 1980, and sets the average age of Congress on a sharper climb. That climb seems to be related to Congress's own legislation. The 1967 Age Discrimination in Employment Act prohibited forced retirement in most industries before the age of 65. In 1978, that act was amended to raise the protected age to 70. Then in 1986, the act was amended to remove any age cap, essentially making it illegal to force anyone into retirement at any age in most sectors of the economy. Interestingly, the demographics of the American workforce began changing immediately after the 1986 amendment.
In 1948, 13 years after the Social Security Act, 27% of the US labor force was 65 or older. An all-time low was reached in 1985, when only 10.8% of the labor force was 65 or older. But the number of older Americans who continued to work began growing, and peaked in 2019 at 20.2%, still much less than the percentage in 1948 when the Current Population Survey began measuring such data, but clearly spurred by the 1986 amendment to the Age Discrimination in Employment Act.
For the first 86 years of the twentieth century, the average age of the United States population rose 8.8 years. That's an increase of 1.2 months every year. During that same period, the average age in Congress barely changed, growing from 52.7 to 53.3. Then the law was amended to allow most people to continue working as long as they wanted without fear of being forced into retirement. In the 38 years between 1986 and 2024, the average age of the US population increased by 7.4 years, or 2.3 months every year, almost double the rate of the previous 86 years. Likewise, the average age of Congressional legislators increased by 7.7 years, or 2.4 months every year, which is an astounding rise that more than doubles the rate of increase from the beginning of the century.
The average tenure in Congress has taken a different path. From 1900 to 1970, the average tenure in Congress increased from 6.1 years to 10.4 years, an increase of over 70%, with an average tenure over those 70 years of 7.4 years. From 1970 to 2024, the average tenure in Congress has hovered around 9.9 years, with a peak of 11.7 years between 2006 and 2008. So while there was a definite spike in average age in Congress after 1986, Congress had clearly established a culture of longer tenures well before 1970.
It may seem like these two stories are unrelated or loosely related. Congress changed the laws of the country in a way that encouraged a longer-living workforce to grow older. But at the same time, Congress itself became older and served for longer tenures. One could argue that while Congress was responding to pressures from lobbies like AARP to end discrimination against older workers, it was also acting in its own interest. That interest was in serving longer as an elected official, as clearly demonstrated by decades of steadily increasing tenures. If Congress established that there was no reason to ask a septuagenarian, octogenarian, or nonagenarian to retire, then there was no reason to not elect an aging politician. Even if its actions were not self-seeking, the result was obviously that Congress became even older than the US workforce.
USA WEALTH DISTRIBUTION BY AGE (IN TRILLIONS OF DOLLARS)
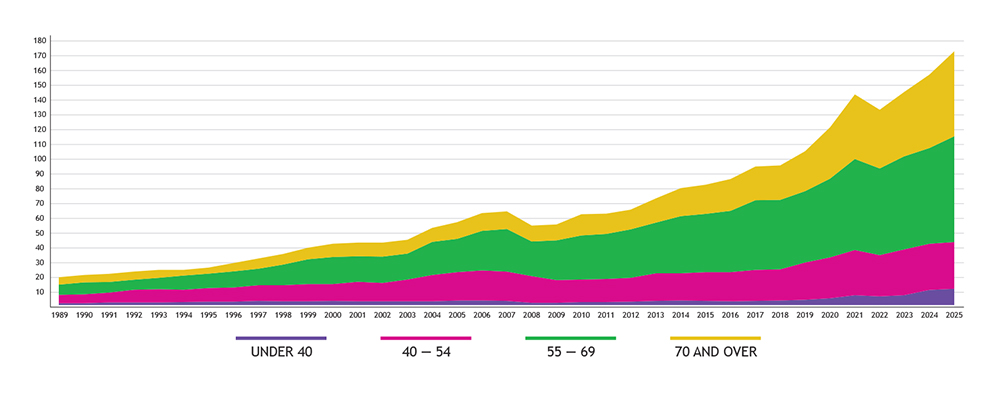
The United States Federal Reserve began tracking distributional financial accounts by age in 1989, separating the country into four age groups: under 40, 40-54, 55-69, and 70 and over. Between 1989 and 2025, the total wealth owned by Americans under 40 years of age increased by 353%, while the wealth owned by those between 40 and 54 increased by 413%. That's impressive until the next two age groups are considered. The wealth of those between 55 and 69 increased by 825%, and it increased by almost 1300% for the oldest group. When graphed, the trends are even more striking. In 1989, the division of wealth between the older and younger groups was almost even, 56% to 44%. By 2025, that gap had radically changed to a 74-26 percent split. Americans under the age of 55 saw their wealth grow by over $36 trillion over the past 36 years, an increase of almost 400%, while those over the age of 55 gained over $115 trillion, an increase of almost 1000%.
For all the headlines, America's gerontocracy is not new and it's not the most extreme it's ever been. But it is a reality, and has been not only since the beginning of the twentieth century, but since the nation was founded. The average lifespan of New World colonists in 1776 was 38. The average age of the signers of the Declaration of Independence was 45. Of the 56 representatives to the Second Continental Congress, only 16 were younger than the average lifespan of the entire country. Our leaders have always skewed older; the difference is that now the ages are more extreme.
There has been a resolution in the House of Representatives since January 2025 to amend the Constitution to limit senators to two terms and representatives to three terms. It has yet to receive any action from the House. According to most legal experts, such an amendment will never likely pass, mostly because the individuals who currently profit from unlimited Congressional tenure are the ones who have to limit that power. Which brings us back to the observation of self-interest, the one thing necessary for any group to retain its power. Wealth and power in the United States has always been vested in the hands of older people, more specifically older, white men. Clearly, the current data demonstrates that the distribution of wealth and power has been on a trend to favor those near the average life expectancy age, and will continue to do so in greater proportions. But there can only be so much outrage about such a disparity. The data also shows that our country has always been this way. And in a representative democracy, we are just as guilty of perpetuating the situation as those who are obviously scheming to maintain their position.
SOURCES
- "Nearly One in Five Older Americans in the Labor Force in 2025" from U.S. Bureau of Labor Statistics
- "Guess Which Half of America Holds 89% of the Wealth" from USA Today
- "Congress, Once Again, Is Getting Older" from NBC News
- "Ages of Members of the 119th Congress (2025-2026)" from Ballotpedia
- "Golden Years: Older Americans at Work and Play" from U.S. Bureau of Labor Statistics
- "Eighty is Different in 2023 than in 1776 - but Even Back Then, a Grizzled Franklin Led Alongside a Young Hamilton" from The Conversation
- "Ages of Revolution: How Old Were They on July 4, 1776?" from Journal of the American Revolution
- "House Judiciary Resolution 12" from the 119th Congress
- "Why Term Limits for Congress Face a Challenging Constitutional Path" from the National Constitution Center



